How to Find a Needle in a Virtualized Network
In distributed architectures networking is usually taken as a given. However, when it does not function as we expect it is often hard to understand the reason. This blog post outlines some general insights into networking with more specific techniques for understanding the networking infrastructure of a Kubernetes cluster.
In software development the art of application logging is a well developed technique for providing invaluable insight into the execution of the application. Without proper insight developers are left with an opaque view of the application, and are left guessing when something does not work as expected.
The same applies to networking. In a world of virtualized infrastructure with potentially several levels of virtualization (e.g. containers on top of VMs on top of physical infrastructure) and where network communication is ubiquitous, we need similar techniques to provide insight into networking.
This blog-post presents techniques to uncover the networking infrastructure in a Kubernetes cluster using a Flannel/VXLAN overlay network and describe tools to inject and observe network traffic. A method for provisioning debugging tools in a ‘cloud-native’ way is also presented.
Networking in Kubernetes
Kubernetes is networking agnostic and does not implement any network overlay. Instead, it employs network plugins to do this work through a standardized Container Network Interface (CNI). Similarly, Kubernetes does not implement any container runtime but instead employs a container runtime through a Container Runtime Interface (CRI).
Understanding (some of) the functionality of the container runtime and the container network plugins are a key to understand the networking infrastructure of Kubernetes. Simplified, the network infrastructure works as follows (the item numbers correspond to the numbers on the network infrastructure depicted below):
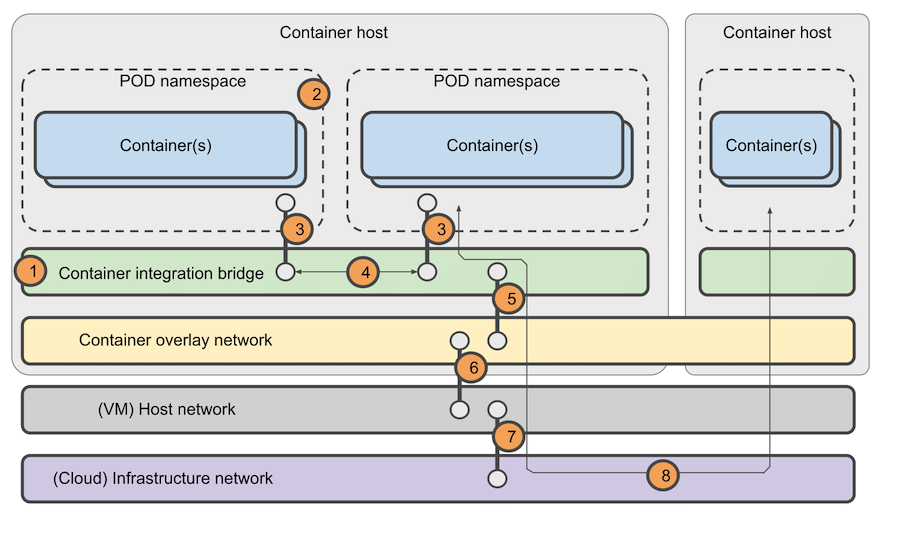
- A container integration bridge is created initially on the container host system. This bridge lives in the host network namespace and is shared across all containers and PODs on the given host for providing network connectivity.
- When a POD is created, the container runtime creates a network namespace for the POD. All the containers of the POD will live in this namespace and each POD will have its own namespace.
- The container network plugin creates a logical ‘cable’ between the POD namespace and the container integration bridge. This is known as a veth pair. Note that there is only one veth pair per POD, even with multi-container pods. The container network plugin also allocates an IP address for the POD from the POD network CIDR.
- Traffic between PODs on the same host traverses the local container integration bridge and does not leave the host.
- Traffic destined for PODs on other hosts are forwarded to the container overlay network. The container network logically spans all hosts in the cluster, i.e. it provides a common layer 3 network for connecting all PODs in the cluster.
- The container overlay network encapsulates POD traffic and forwards it to the host network. The host network ensures the traffic ends up on the host containing the target POD and the reverse of the steps above are applied.
- Whether the cluster hosts are VMs or bare-metal systems there will inevitably be an infrastructure below these hosts. It is not always possible to gain access to this infrastructure. However, this infrastructure can be a considerable source of network issues so it is important to remember that it exists.
- Traffic between PODs on different hosts always traverse the container overlay network, the host network, and the infrastructure network.
Dissecting a Flannel Kubernetes Network
Above we presented a general picture of a container network infrastructure. In this section we will go into more details on each item and describe how to investigate each component.
Understanding the networking architecture probe points and the IP and MAC addresses used in the cluster such that traffic from different components can be identified and separated is a key to debugging networking issues.
Integration Bridge
The integration bridge is a layer 2 component on each host. The command brctl show will show bridges on a given host and the bridge ports/interfaces. With a Flannel network the integration bridge is typically named as cni0.
Network Namespaces
Network namespaces can typically be listed using ip netns list. However, if the container runtime is Docker, you will not be able to list namespaces this way because Docker does not sym-link the namespaces under /var/run/netns. You can enable ip netns namespace functionality by creating the necessary sym-link yourself: ln -s /var/run/docker/netns /var/run/netns
Did you ever wonder about what all those pause containers do?
The pause containers are an implementation detail of a Docker-based container runtime and they serve as a holding point for volumes and network interfaces for a POD, hence there is a pause container for each POD on a host. All the ‘real’ containers of a POD inherit volumes and network interfaces from the POD pause container.
Discovering Veth Endpoints
Identifying veth pair endpoints is essential to be able to follow traffic in and out of a given POD. Endpoint pairing can be done by listing interfaces inside a given container and matching interface numbers with the interface list as seen from the host namespace. For example, inside a container we see eth0 numbered as 33 using ip link list:
$ kubectl exec nwtool-857cc9748c-8qrdm -- ip link list
3: eth0@if33: <BROADCAST,MULTICAST,UP,LOWER_UP> mtu 1450 state UP ...
     link/ether 0a:58:0a:2a:03:05 brd ff:ff:ff:ff:ff:ff link-netnsid 0
Similarly, we locate interface 33 as seen from the host:
vm-192.168.122.245$ ip link list
...
33: vetha7270fef@if3: <BROADCAST,MULTICAST,UP,LOWER_UP> mtu 1450 state UP ...
    link/ether f2:7f:1b:8e:84:21 brd ff:ff:ff:ff:ff:ff link-netnsid 3
From this we see that eth0 inside the container is paired with interface vetha7270fef on the host side.
POD IP Address Allocation and Routing
Understanding POD IP allocation and routing is important because it allows us to better identify network traffic, understand where the traffic is flowing, and probe the traffic in the right places.
The Flannel-managed route table on each cluster node reflects how the POD subnet is distributed across nodes. The POD network CIDR and other Flannel parameters can be found in the Kubernetes ConfigMap named kube-flannel-cfg:
$ kubectl -n kube-system get configmap kube-flannel-cfg -o yaml ...
 net-conf.json: |
   {
     "Network": "10.244.0.0/16",
     "Backend": {
       "Type": "vxlan"
     }
    }
This /16 POD subnet is distributed across the cluster host and the per-host POD CIDR can be found as follows:
$ kubectl get nodes -o jsonpath='{range .items[*]}  \
  {.metadata.name}{" "}{.spec.podCIDR}{"n"}{end}'
vm-192-168-122-245 10.244.0.0/24
vm-192-168-122-246 10.244.1.0/24
vm-192-168-122-247 10.244.2.0/24
This shows that each node handles a /24 POD subnet, hence a maximum of 256 PODs per host. Finally, the routing table shows how traffic for the local POD CIDR 10.244.0.0/24 is routed to the integration bridge cni0 whereas the POD CIDRs for the other hosts are routed to the flannel.1 port with the other bridges as gateways, hence the container overlay network:
vm-192-168-122-245$ route -n
Destination Gateway Genmask Flags Metric Ref Use Iface
...
10.244.0.0 0.0.0.0 255.255.255.0 U 0 0 0 cni0
10.244.1.0 10.244.1.0 255.255.255.0 UG 0 0 0 flannel.1
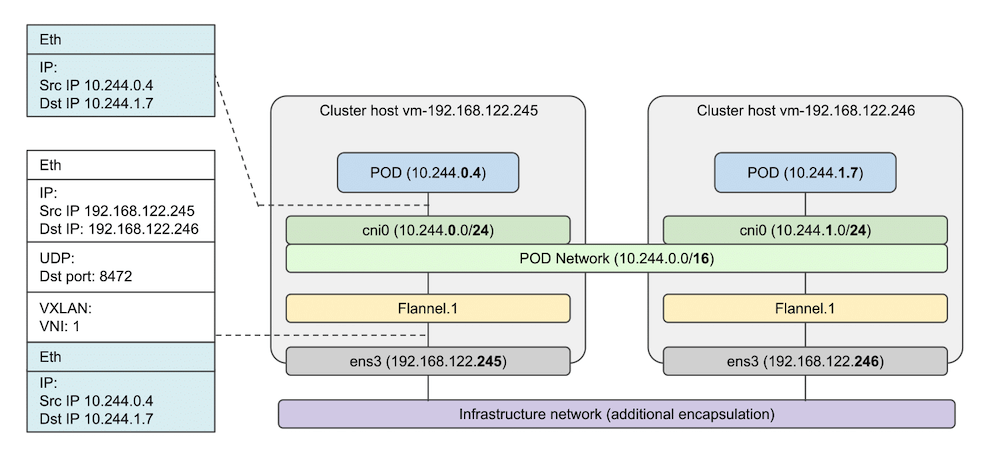
10.244.2.0 10.244.2.0 255.255.255.0 UG 0 0 0 flannel.1Kubernetes Overlay Network Encapsulation
Flannel builds the overlay network using VXLAN encapsulation. This is illustrated below where a POD sends a packet to a POD on another host. The L2 packet is encapsulated inside a VXLAN packet which includes UDP and IP headers. This results in a total encapsulation overhead of 50 bytes. Flannel takes this overhead into consideration when creating the container integration bridge. Depending on which probe-points are being investigated we need to keep the encapsulation in mind since the observed IP addresses could be from the outer IP header. To filter on encapsulated POD IP addresses we can e.g. match on fixed fields like the inner IP dest address like this:tcpdump -vv -nn -XX -i ens3 'udp port 8472 && udp[46:4]=0x0af40103'
In many cases the infrastructure network will be a virtual network in itself (a ‘VPC’ in a cloud environment) that can also encapsulate traffic from the cluster hosts so that traffic from these hosts can be separated from other hosts. This means another encapsulation overhead which might or might not be taken into consideration when designing the Kubernetes overlay network maximum transmission unit (MTU). If the MTU settings are not aligned between infrastructure and the Kubernetes overlay network, IP fragmentation will make packet inspection more difficult.
Routing and encapsulation are important differentiators for the different Kubernetes network overlays. Several of the network plugins build an L2 overlay network as shown with Flannel. However, others build a L3 network using e.g. IP-in-IP encapsulation (such as Flannel using the IPIP backend or Calico) and thus have less overhead. Overlay networks supporting encryption will also introduce additional overhead for e.g. IPsec headers.
Network Debugging Tools
Linux supports a vast amount of networking tools and they generally fall into three different groups: tools to view the configuration of the network, tools to monitor traffic at probe points, and tools to generate test traffic.
We have already seen examples of tools to view network configuration, namely ip, brctl, route and the location of various Flannel related configuration. In addition, arp can be used to show the ARP cache which is useful when debugging L2 issues and ethtool will show interface related parameters, including offload features.
For monitoring traffic at selected probe-points, the terminal based tcpdump tool is universal. Understanding a little bit of the filtering language goes a long way to limiting a potential unrelated firehose of traffic from applications. It is not usually necessary to use the graphical wireshark tool for debugging networking issues, except possibly for situations where longer packet sequences need to be analyzed.
When the traffic from real applications is not sufficient for debugging we can inject controlled test traffic using a number of tools. Injecting controlled test traffic also allows for synchronizing packet injection with other network events (e.g. open TCP (L4) connection and observe ARP (L2) request/response). Since most Kubernetes traffic is L4 TCP or UDP traditional L2/L3 tools like arping and ping are not always useful. Instead, creating brief TCP connections using nc (netcat) is very useful (the -z argument provides a connect-and-close feature - a feature very useful for scripting). For connections where e.g. https is useful curl is a very capable tool.
Provisioning Tools the Cloud Native Way
Many container images are minimal images in the sense that they do not include tools which are not essential to the primary function of the image, so you might not be able to use the tools mentioned here from those images. Similarly, your Kubernetes cluster hosts might be using a VM image that does not include the necessary tools.
Obviously, we could simply include the tools in the necessary images or install the tools on the cluster nodes, but this is a cloud-native anti-pattern. You should definitely avoid ssh-ing into cluster nodes to install tools because it can have undesirable side-effects.
A possible work-around to this problem is to use dedicated debugging container images which can be used to create containers in the architecture being debugged. Praqma has developed a Network Multitool specifically for debugging and testing network issues.
Using the network multitool on the POD network is straight-forward using kubectl run:
kubectl run multitool --image=praqma/network-multitool --restart Never
As an alternative to installing tools directly on the cluster hosts, the multitool can be run using the host network namespace instead of a private network namespace. The Network Multitool github repository contains a manifest file for deploying the multitool as a Kubernetes DaemonSet which can be exec’ed into to run the tools on the host. This allows for debugging on the host network while keeping the cluster hosts immutable.
Published: Jan 7, 2019
Updated: Mar 25, 2024